Hdf5 files I: Rates and fractions
These files contain cooling and heating rates, ion fractions, dust depletion factors,
as well as molecule and free electron abundances.
Download the rates and fractions hdf5 tables
An hdf5 datafile is available for each model listed in Table 5 of Ploeckinger & Schaye (MNRAS, accepted).
- Click here to download the hdf5 file for the fiducial model (UVB_dust1_CR1_G1_shield1). (Available now!)
- Click here to go to the download page for all models (Available now!)
Helpful commands
After downloading the tables, they can be browsed with an hdf viewer
(e.g. hdfview). In case no hdf viewer is available
or for a quick overview of the datasets, the following commands are useful (for more info click
here).
List all datasets in the hdf5 files:
> h5ls -r UV_dust1_CR1_G1_shield1.hdf5
Each dataset has the attributes "Info", "Dimension", and "Unit" for more details. The attributes can be displayed with:
> h5dump -a '/Info' UV_dust1_CR1_G1_shield1.hdf5
> h5dump -a '/Dimension' UV_dust1_CR1_G1_shield1.hdf5
> h5dump -a '/Unit' UV_dust1_CR1_G1_shield1.hdf5
where is the name of any dataset in the list returned by the "h5ls -r" command, for example:
> h5dump -a '/Tdep/Cooling/Info' UV_dust1_CR1_G1_shield1.hdf5
Back to top
Hdf5 files II: Line emissivities
These files contain the line emissivities for the 183 lines listed in Table 7 of the paper.
Download the line emissivities tables
An hdf5 datafile is available for the fiducial model (UVB_dust1_CR1_G1_shield1) as well
as the unshielded version of the fiducial model (UVB_dust1_CR1_G1_shield0).
- Click here to download the hdf5 file for the fiducial model (UVB_dust1_CR1_G1_shield1). (Available now!)
- Click here to go to the download page for all available models. (Available now!)
Back to top
UV/X-ray background (mod. FG20)
For use in Cloudy (tested for v17.01)
The UV/X-ray background used in this work ("mod. FG20")
is based on the spectrum by
Faucher-Giguère (2020) ("FG20") but the input radiation field is
attenuated by a column of neutral hydrogen until hydrogen reionization is complete and by a
column of singly ionized helium until helium reionization is complete.
This radiation field can be used in Cloudy
by replacing the file "hm12_galaxy.ascii" in the
data folder and using the standard "table hm12 redshift 0.0" command. This was tested for
Cloudy v17.01 but should work for a variety of Cloudy versions.
- Click here to download the ascii file for the modified FG20 radiation field
and for more details on the format of the file.
Back to top
Graphical user interface (gui)
Explore and plot the content of the 4 dimensional tables.
Download and use the gui
This python-based gui uses the
tkinter package and is hosted on github.
After downloading the hdf5 and the python gui files, the gui can be started with:
> python3 CoolingTablesGUI_main.py
Note: All images will be saved to the folder where the gui is started from.
Tip: Create an
alias for the above command line to easily start the gui.
Once the window appears (
preview on github), the model (1), the redshift (2)
and the metallicity (3) can be selected. For constant density plots, if selected
in (5), also the density (4) is used. The drop-down menu in (5) allows one to
plot a variety of datasets. The options are a 2D plot (density - temperature),
a 1D plot for constant density, as well as a 1D plot (x-axis: density) at the
thermal equilibrium temperature for each density.
The plot can either be "displayed" (left button) or "saved" (right button).
Back to top
Routines to couple to hydro code
C routines
Download and use the C routines
A compilation of C routines to read in and interpolate the tables to return
the net cooling rate for a given redshift, metallicity, temperature, and density
is hosted on github. Individual routines can be directly used and/or adapted
to be coupled to a hydrodynamics code.
Back to top
Supplementary figures
Figure gallery
Ion fractions
The figures below show the ion fractions for the gas phase at the thermal
equilibrium temperature of the last Cloudy zone (i.e. the temperature where
cooling rate = heating rate) for solar metallicity gas at z=0, using the fiducial model
(UVB_dust1_CR1_G1_shield1). All figures were made with the python gui.
Back to top
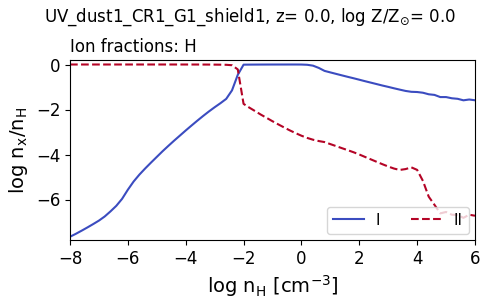
Hydrogen
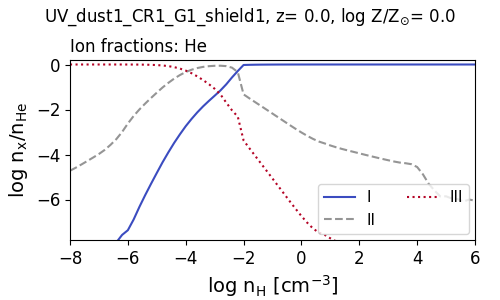
Helium
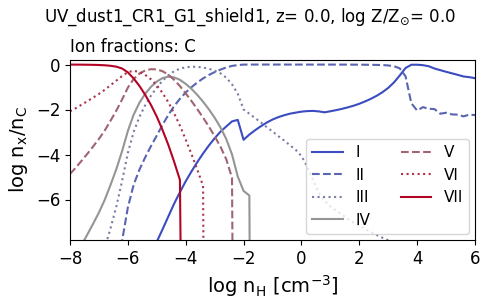
Carbon
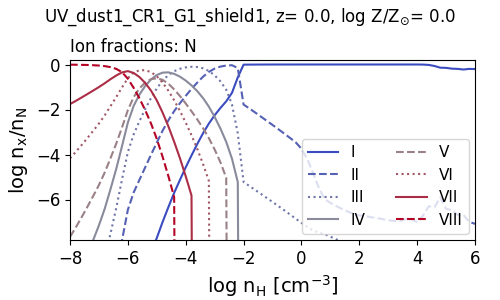
Nitrogen
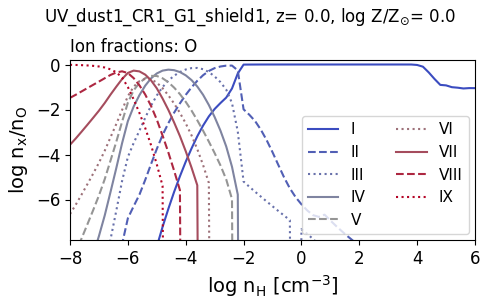
Oxygen
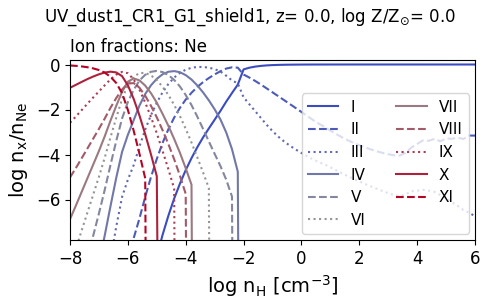
Neon
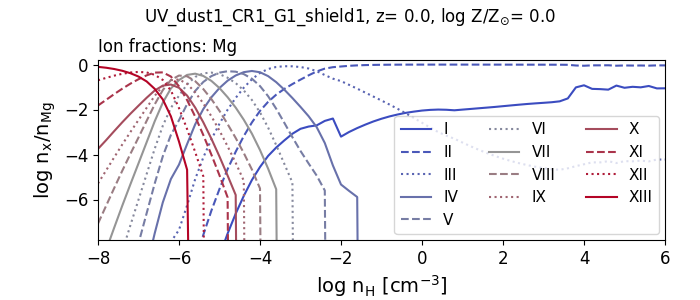
Magnesium
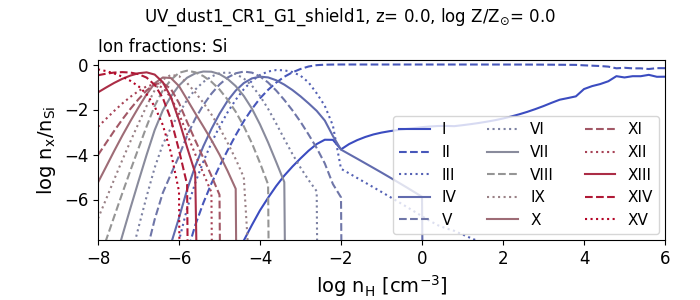
Silicon
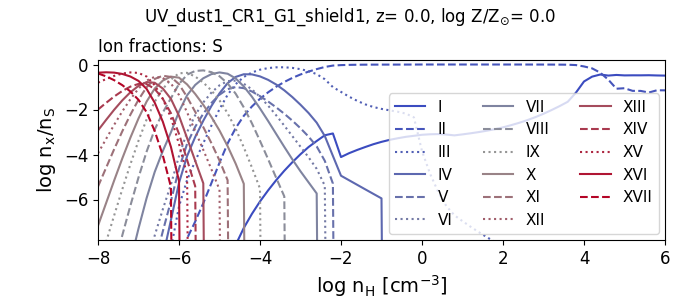
Sulphur
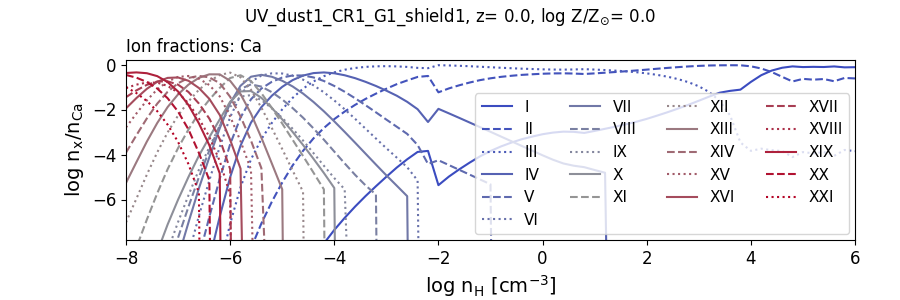
Calcium
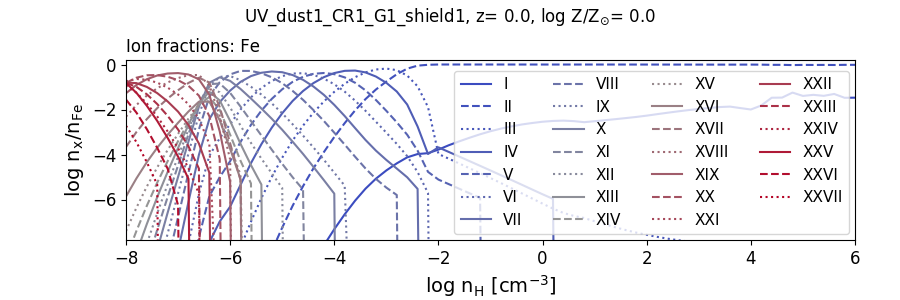
Iron